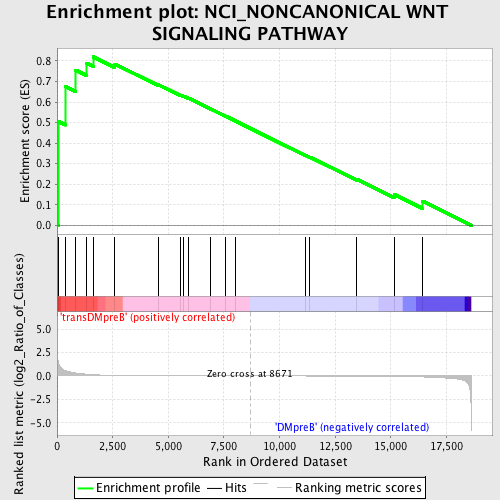
Profile of the Running ES Score & Positions of GeneSet Members on the Rank Ordered List
| Dataset | Set_04_transDMpreB_versus_DMpreB.phenotype_transDMpreB_versus_DMpreB.cls #transDMpreB_versus_DMpreB.phenotype_transDMpreB_versus_DMpreB.cls #transDMpreB_versus_DMpreB_repos |
| Phenotype | phenotype_transDMpreB_versus_DMpreB.cls#transDMpreB_versus_DMpreB_repos |
| Upregulated in class | transDMpreB |
| GeneSet | NCI_NONCANONICAL WNT SIGNALING PATHWAY |
| Enrichment Score (ES) | 0.8197794 |
| Normalized Enrichment Score (NES) | 1.4726429 |
| Nominal p-value | 0.04225352 |
| FDR q-value | 0.99423456 |
| FWER p-Value | 1.0 |
| PROBE | DESCRIPTION (from dataset) | GENE SYMBOL | GENE_TITLE | RANK IN GENE LIST | RANK METRIC SCORE | RUNNING ES | CORE ENRICHMENT | |
|---|---|---|---|---|---|---|---|---|
| 1 | MAP3K7IP1 | 2193 2171 22419 | 59 | 1.517 | 0.5051 | Yes | ||
| 2 | GNAS | 9025 2963 2752 | 376 | 0.559 | 0.6753 | Yes | ||
| 3 | NLK | 5179 5178 | 838 | 0.311 | 0.7546 | Yes | ||
| 4 | MAP3K7 | 16255 | 1335 | 0.182 | 0.7891 | Yes | ||
| 5 | GNG2 | 4790 | 1631 | 0.139 | 0.8198 | Yes | ||
| 6 | CAMK2A | 2024 23541 1980 | 2597 | 0.051 | 0.7849 | No | ||
| 7 | WNT5A | 22066 5880 | 4541 | 0.013 | 0.6848 | No | ||
| 8 | PLCG1 | 14753 | 5548 | 0.008 | 0.6333 | No | ||
| 9 | WNT11 | 5876 | 5684 | 0.007 | 0.6285 | No | ||
| 10 | CDC42 | 4503 8722 4504 2465 | 5905 | 0.007 | 0.6189 | No | ||
| 11 | WNT4 | 16025 | 6898 | 0.004 | 0.5669 | No | ||
| 12 | NFATC2 | 5168 2866 | 7583 | 0.002 | 0.5308 | No | ||
| 13 | FZD3 | 21784 | 8019 | 0.001 | 0.5079 | No | ||
| 14 | CSNK1A1 | 8204 | 11164 | -0.006 | 0.3408 | No | ||
| 15 | YES1 | 5930 | 11364 | -0.006 | 0.3322 | No | ||
| 16 | WNT6 | 5881 | 13475 | -0.017 | 0.2246 | No | ||
| 17 | FZD6 | 22486 | 15177 | -0.046 | 0.1484 | No | ||
| 18 | GNB1 | 15967 | 16431 | -0.109 | 0.1175 | No |

